How does Tetragon Financial Group generate steady returns from permanent capital and asset-management stakes?
Tetragon Financial Group uses permanent capital to hold illiquid assets and minority stakes in asset managers, aiming for stable income and capital gains. In 2025 it reported NAV movements tied to private investments and fee-related earnings, highlighting resilience amid market swings.
Tetragon mixes recurring management and performance fees with direct investment returns, supporting cash yields and NAV growth; see Tetragon SWOT Analysis for a focused product review.
What Does Tetragon Actually Sell?
Tetragon Financial Group sells access to a diversified portfolio of alternative assets via publicly traded non-voting shares, offering investors pooled exposure to private equity, venture capital, credit, real estate, and infrastructure without direct deal-level management.
Tetragon Financial Group provides a listed investment vehicle that holds stakes in funds, operating companies, and credit strategies. Investors gain exposure to private and public alternative investments through a single traded security, including material holdings in firms such as Ripple Labs and Equitix.
Tetragon serves retail and institutional investors seeking alternative investment returns without direct fund commitments, including wealth managers, pension funds, and private investors who want diversified, high-alpha strategies but prefer liquidity via Euronext Amsterdam and the London Stock Exchange listings.
Shareholders receive professionalized access to alternative assets, potential high-return opportunities, and dividend distributions when declared; for fiscal 2025 Tetragon reported net asset value (NAV) per share and portfolio realizations that underpinned its dividend policy and liquidity profile, allowing investors to participate in private-market upside with public-market tradability.
Investors pick Tetragon for simplified access to a diversified basket of alternatives, lower individual investment minimums compared with direct private equity, and active capital allocation by experienced managers. The listed structure supports liquidity, transparent reporting in the How Tetragon Company Sells article, and alignment via portfolio-level governance.
Tetragon SWOT Analysis
- Complete SWOT Breakdown
- Fully Customizable
- Editable in Excel & Word
- Professional Formatting
- Investor-Ready Format

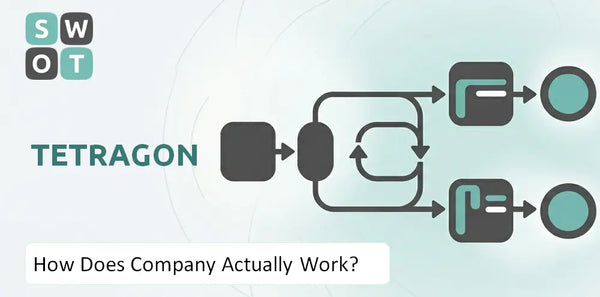
How Does Tetragon Run Day to Day?
Tetragon Financial Group runs day-to-day through a dual-track operating model: direct, catalyst-driven investing from its balance sheet and a platform (Tetragon Partners) that seeds and scales asset managers, managed by Tetragon Financial Management LP.
Dual-track operating model
Tetragon Financial Group combines balance-sheet investments in life sciences, digital assets, and resource finance with a platform approach that acquires and incubates asset management businesses.
How investors access strategies
Clients access manager strategies via third-party AUM run by platform partners; Tetragon supplies seed capital and governance so managers can scale product offerings to institutional and retail channels.
Investment origination and development
Deal teams at Tetragon Financial Management LP originate direct investments, run diligence, and deploy catalyst-driven capital while partner teams launch new funds and operationally build management firms.
Distribution and fundraising
Distribution uses institutional sales, third-party platforms, and partner-led fundraising to grow AUM; by early 2025 third-party AUM exceeded 42,000,000,000 dollars.
Operational backbone and partnerships
Centralized operational infrastructure-legal oversight, risk, compliance, finance, and middle-office-supports portfolio managers and reduces fixed costs for scale and speed to market.
Primary driver of efficiency
The model works because seed capital plus shared services accelerate manager growth and capture fees, carried interest, and balance-sheet upside across multiple layers of the investment chain.
Daily mechanics of Tetragon Financial Group operations
Tetragon runs daily operations by sourcing direct investments, providing seed capital and infrastructure to platform managers, and centrally managing legal, risk, and finance to scale third-party AUM and monetize both balance-sheet and fee-based positions.
- Dual-track model: direct balance-sheet investments plus Tetragon Partners platform
- Delivery: seed capital, fund launches, and centralized operational support to asset managers
- Key system: centralized legal, compliance, risk, finance, and distribution partnerships
- Efficiency engine: shared services and catalytic capital accelerate AUM growth and fee capture
Read more context and corporate history in this article: History of Tetragon Company Explained
Tetragon PESTLE Analysis
- Covers All 6 PESTLE Categories
- No Research Needed – Save Hours of Work
- Built by Experts, Trusted by Consultants
- Instant Download, Ready to Use
- 100% Editable, Fully Customizable

How Does Money Come In at Tetragon?
Money flows into Tetragon Financial Group through capital appreciation, investment income, and fee-based revenue. The firm monetizes stakes in private assets and GP stakes, collects recurring management/performance fees, and returns cash to shareholders via dividends.
Realized capital gains from portfolio exits and mark-to-market increases are the largest revenue source; in 2025 Tetragon Financial Group reported total revenue of 1.027 billion dollars, driven by large gains including 432 million dollars from Equitix, 333 million dollars from Ripple Labs, and 260 million dollars from Hawke's Point.
Tetragon earns interest, dividends, and income from fund investments plus recurring management and performance fees from GP stakes; by 2025 fee-based revenue composed roughly 30 to 35 percent of total economic income, supporting steadier cashflow.
Monetization is a mix: carried interest and management fees from asset managers, coupon/dividend income from holdings, and one-off exit gains when assets are sold; revenue is therefore both recurring and event-driven.
Large single-asset exits and valuation uplifts drive volatility and upside, while GP stakes deliver recurring fee streams that smooth earnings; in 2025 exits and revaluations were the dominant factor behind the revenue jump versus 2024's 521 million dollars.
How Money Comes In at Tetragon Financial Group
Tetragon turns investments into revenue by combining capital gains from portfolio exits with recurring fee income from GP stakes and periodic investment income; it paid total dividends of 0.45 dollars per share for full-year 2025.
- Capital gains on portfolio companies (Equitix, Ripple Labs, Hawke's Point)
- Recurring management and performance fees from GP stakes and asset managers
- Mixed monetization: carried interest, management fees, investment income, and realized exits
- Primary driver: large valuations and exits in 2025, supported by GP stake fee economics
For context on competitors and industry positioning see Who Tetragon Company Competes With
Tetragon SOAR Analysis
- Complete SOAR Analysis
- Effortlessly Communicate Your Business Strategy
- Investor-Ready Format
- 100% Editable and Customizable
- Clear and Structured Layout

What Makes Tetragon's Model Strong or Fragile?
Tetragon Financial Group's model is strong due to its permanent capital base and diversified exposure across asset managers, private equity, and credit, which reduce forced liquidations. Key vulnerabilities are a wide market NAV discount and sensitivity to interest rate shifts, especially SOFR transitions, that stress credit portfolios and perceived liquidity.
Tetragon Financial Group benefits from a permanent capital structure that removes redemption pressure and lets it hold assets through market cycles, supporting patient capital deployment and long-dated value realization.
The tetragon asset management model spans external asset managers, direct private equity stakes, and credit investments, which together hedge sector-specific downturns and smooth returns across economic regimes.
Tetragon's results depend on successful exits (private equity realizations), manager performance, and credit spreads; concentrated positions or delayed exits amplify liquidity and valuation risk.
As of 2025 the model is resilient structurally but exposed operationally: NAV strength exists, yet market trust is weak due to a deep share-price discount and interest-rate sensitivity; planned monetizations in 2026 aim to shore balance sheet and buybacks.
Why the model is strong but also fragile
Tetragon's permanent-capital, diversified asset mix underpins strength, while a large NAV/share discount and SOFR-driven credit sensitivity are the primary fragilities; 2026 strategic exits target deleveraging and buybacks to narrow the gap.
- The main structural strength is permanent capital that prevents forced liquidations and enables long-hold strategies.
- The most important capability is diversification across asset managers, direct private equity stakes, and credit portfolios providing cross-sector hedges.
- The key dependency is liquidity from successful exits and market confidence; the December 2025 share price of 17.35 versus NAV per share of 41.88 shows this risk.
- The model looks structurally resilient but market-exposed in 2025/2026 due to valuation discounting and interest-rate (SOFR) sensitivity; planned 475,000,000 gross proceeds from a BGO stake sale in 2026 aim to reduce debt and execute buybacks.
For further context on strategy and governance see What Tetragon Company Stands For
Tetragon VRIO Analysis
- Covers VRIO Analysis in Details
- Structured for Consultants, Students, and Founders
- 100% Editable in Microsoft Word & Excel
- Instant Digital Download – Use Immediately
- Compatible with Mac & PC – Fully Unlocked

Related Blogs
- What Does Tetragon Company Stand For?
- How Did Tetragon Company Become What It Is Today?
- Who Owns Tetragon Company and Why Does It Matter?
- How Does Tetragon Company Sell Its Products and Services?
- Where Is Tetragon Company Going Next?
- Who Does Tetragon Company Serve?
- Who Does Tetragon Company Compete With?
Frequently Asked Questions
Tetragon sells access to a diversified portfolio of alternative assets through publicly traded non-voting shares. Investors get pooled exposure to private equity, venture capital, credit, real estate, and infrastructure without handling direct deal-level management themselves.
Disclaimer
All information, articles, and product details provided on this website are for general informational and educational purposes only. We do not claim any ownership over, nor do we intend to infringe upon, any trademarks, copyrights, logos, brand names, or other intellectual property mentioned or depicted on this site. Such intellectual property remains the property of its respective owners, and any references here are made solely for identification or informational purposes, without implying any affiliation, endorsement, or partnership.
We make no representations or warranties, express or implied, regarding the accuracy, completeness, or suitability of any content or products presented. Nothing on this website should be construed as legal, tax, investment, financial, medical, or other professional advice. In addition, no part of this site - including articles or product references - constitutes a solicitation, recommendation, endorsement, advertisement, or offer to buy or sell any securities, franchises, or other financial instruments, particularly in jurisdictions where such activity would be unlawful.
All content is of a general nature and may not address the specific circumstances of any individual or entity. It is not a substitute for professional advice or services. Any actions you take based on the information provided here are strictly at your own risk. You accept full responsibility for any decisions or outcomes arising from your use of this website and agree to release us from any liability in connection with your use of, or reliance upon, the content or products found herein.