How does Newell Brands generate cash from selling everyday consumer goods and pruning brands?
Newell Brands aggregates global housewares, writing instruments, and outdoor products, monetizing scale via retailer partnerships and cost cuts; in 2025 it reported improved free cash flow and divestiture gains supporting debt reduction, signaling operational pivot and margin focus.
Newell Brands tightens SKUs and shifts sales toward higher-margin SKUs to lift operating margins; its multi-channel retail reach and licensing collect steady royalties and recurring revenue. See product-level strategy in Newell Brands SWOT Analysis
What Does Newell Brands Actually Sell?
Newell Brands sells everyday household and professional staples across three reporting segments: Home and Commercial Solutions, Learning and Development, and Outdoor and Recreation, delivering well-known branded products that customers trust for reliability and convenience.
Newell Brands offers storage and kitchen solutions (Rubbermaid, FoodSaver), home fragrance (Yankee Candle), writing instruments and office supplies (Sharpie, Paper Mate, EXPO), and outdoor gear and hydration (Coleman, Contigo, bubba). Revenue is concentrated in consumer staples categories with durable, repeat-purchase goods.
Customers include households, small businesses, schools, and outdoor enthusiasts; retail partners span mass merchants, grocery, office-supply chains, and e-commerce platforms. Institutional buyers and professional users also source organizational and commercial products.
Customers get reliable, recognizable brands that simplify everyday tasks and reduce replacement risk; product breadth enables cross-selling and category dominance. In 2025, the Learning and Development segment alone accounted for roughly 35 percent of North American writing-instrument market share, underpinning recurring revenue.
Customers pick Newell Brands for brand familiarity, widespread retail distribution, and portfolio depth that makes the products hard to replace. The company's Newell Brands business model focuses on scale in manufacturing, centralized supply-chain operations, and brand-led marketing to sustain margins and shelf presence; see Where Newell Brands Company Is Going for strategic context.
Newell Brands SWOT Analysis
- Complete SWOT Breakdown
- Fully Customizable
- Editable in Excel & Word
- Professional Formatting
- Investor-Ready Format

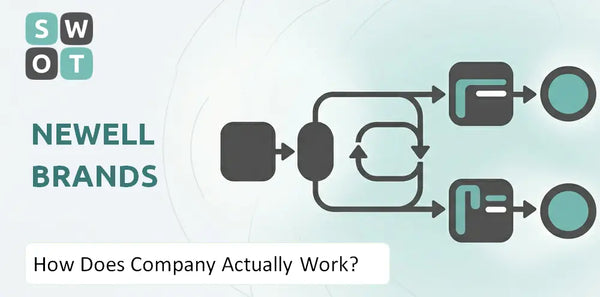
How Does Newell Brands Run Day to Day?
Newell Brands runs day to day under a Simplify, Focus and Grow turnaround: concentrating operations on its top 25 brands that drive roughly 90 percent of net sales, centralizing decision-making, and coordinating global production with a large retail-focused distribution engine.
Operating model: Focused portfolio, centralized ops
Newell Brands business model centers on simplifying the brand portfolio to 25 core brands and allocating capital and management to those priorities. Daily decisions prioritize cost reduction, SKU rationalization, and cross-brand shared services.
Product delivery: Retail-first and growing DTC tests
Products move from factories into large retailers and e-commerce partners; mass retailers (Walmart, Target, Amazon) represented about 55 percent of revenue in 2024, while Newell runs targeted direct-to-consumer pilots in categories like home fragrance.
Production & sourcing: Global manufacturing with tariff risk
Manufacturing is global and outsourced to contract manufacturers and owned plants across Asia, North America, and Latin America. Geopolitical exposure showed up as $174 million in cash tariff costs in 2025, highlighting supply-chain volatility.
Sales channels: Mass retail, e – commerce, wholesale
Day-to-day sales execution focuses on mass retail account management, category resets, promotional calendars, and digital shelf excellence on Amazon and retailer sites; wholesale and club channels fill the rest of volume.
Key assets & partnerships: Distribution and brand equity
Core assets include large distributor relationships, centralized ERP and demand-planning systems, and partnerships with major retailers. Shared services (finance, procurement, logistics) lower overhead across the brand portfolio.
Why it works: Scale plus concentrated management
The operating model scales by concentrating marketing and R&D spend on best-selling brands, simplifying SKUs, and using retailer scale to secure shelf space and promotions-so margin recovery and cash flow improvement become measurable.
How Newell Brands Runs Day to Day
Day-to-day, Newell Brands orchestrates global production, retailer account management, and centralized support functions to push inventory through large retail channels while testing direct-to-consumer initiatives and enforcing cost discipline across the top 25 brands.
- Core operating model: portfolio focus on top 25 brands driving ~90 percent of net sales
- Product delivery: mass-retailer and e-commerce fulfillment with growing DTC pilots
- Main channel/support: Walmart, Target, Amazon account management plus centralized ERP and logistics
- Efficiency driver: SKU rationalization, shared services, and concentrated marketing spend
Who Newell Brands Company Serves
Newell Brands PESTLE Analysis
- Covers All 6 PESTLE Categories
- No Research Needed – Save Hours of Work
- Built by Experts, Trusted by Consultants
- Instant Download, Ready to Use
- 100% Editable, Fully Customizable

How Does Money Come In at Newell Brands?
Money comes into Newell Brands mainly from selling high-volume physical consumer goods across a broad brand portfolio; the firm monetizes through a mix of unit volume and pricing power, supported by cost savings and channel distribution.
Newell Brands generates most revenue by selling branded household, writing, and baby products through mass retailers, online channels, and distributors; these consumer goods account for the bulk of net sales and define the business model.
Secondary streams include licensing, private-label manufacturing, and commercial/industrial sales via subsidiaries; services like extended warranties and co-pack arrangements augment product revenue.
Newell Brands uses one-time unit sales with strategic pricing tiers, trade promotions, and retailer rebates; pricing power and productivity savings offset volume declines and inflation.
Scale in North America, product mix (higher-margin items), repeat household demand, and retail distribution density drive revenue; geographic concentration amplifies sensitivity to U.S. retail trends.
How money comes in at Newell Brands
Newell Brands converts product demand into cash by selling branded consumer goods at scale, using pricing and productivity to preserve margins; in full-year 2025 net sales were 7.2 billion dollars with a normalized gross margin of 34.2 percent, and North America remained the dominant market (about 68 percent of sales in 2024).
- High-volume retail sales of household, writing, and baby products
- Licensing, private-label, commercial channels, and service add-ons
- One-time unit sales with retailer pricing, promotions, and mix management
- Geographic scale in North America and product mix are the strongest drivers
Read more on how the company sells and distributes products in this detailed piece: How Newell Brands Company Sells
Newell Brands SOAR Analysis
- Complete SOAR Analysis
- Effortlessly Communicate Your Business Strategy
- Investor-Ready Format
- 100% Editable and Customizable
- Clear and Structured Layout

What Makes Newell Brands's Model Strong or Fragile?
Newell Brands' model is strong because of deep brand equity and entrenched big-box retail placement, but fragile due to high leverage, multi-year revenue decline, and trade-policy sensitivity. Key dependencies are innovation to reverse category contraction and deleveraging to reduce default risk.
Newell Brands benefits from a broad brand portfolio and decades of shelf presence that make it costly for retailers to remove core SKUs; that distribution advantage supports steady wholesale demand and promotional leverage across outlets.
Physical retail relationships, a diverse brand portfolio, centralized procurement, and scale in supply-chain contracts provide cost advantages and margin support if sales stabilize.
Newell Brands depends on large U.S. retail partners, continued private-label resistance, and consistent product innovation; weakness in any of these-plus tariff exposure-can compress margins quickly.
For 2025 the model looks exposed: revenue fell from 10.6 billion in 2021 to 7.2 billion in 2025 and net debt stood at 4.7 billion at end – 2025. Management projects flat net sales and operating cash flow improving to between 350 million and 400 million in 2026, but resilience depends on successful new-product cycles and continued cost takeout.
What Makes the Model Strong or Fragile
Newell Brands works because entrenched retail distribution and brand equity limit displacement; it is weakened by leverage, declining top line, and tariff sensitivity that can swing P&L materially.
- Entrenched retail distribution and well-known brands provide durable shelf access
- Scale in procurement and a diversified brand portfolio are the most important capabilities
- High leverage (4.7 billion debt end – 2025), top – line decline to 7.2 billion in 2025, and tariff exposure (projected 150 million P&L hit in 2026) are key constraints
- Model is exposed in 2025 but could stabilize in 2026 if innovation outpaces category contraction and operating cash flow reaches 350-400 million
See context on competitors and market positioning in this article: Who Newell Brands Company Competes With
Newell Brands VRIO Analysis
- Covers VRIO Analysis in Details
- Structured for Consultants, Students, and Founders
- 100% Editable in Microsoft Word & Excel
- Instant Digital Download – Use Immediately
- Compatible with Mac & PC – Fully Unlocked

Related Blogs
- What Does Newell Brands Company Stand For?
- How Did Newell Brands Company Become What It Is Today?
- Who Owns Newell Brands Company and Why Does It Matter?
- How Does Newell Brands Company Sell Its Products and Services?
- Where Is Newell Brands Company Going Next?
- Who Does Newell Brands Company Serve?
- Who Does Newell Brands Company Compete With?
Frequently Asked Questions
Newell Brands sells everyday household and professional staples across Home and Commercial Solutions, Learning and Development, and Outdoor and Recreation. Its brands include Rubbermaid, FoodSaver, Yankee Candle, Sharpie, Paper Mate, EXPO, Coleman, Contigo, and bubba, with products built for repeat use and convenience.
Disclaimer
All information, articles, and product details provided on this website are for general informational and educational purposes only. We do not claim any ownership over, nor do we intend to infringe upon, any trademarks, copyrights, logos, brand names, or other intellectual property mentioned or depicted on this site. Such intellectual property remains the property of its respective owners, and any references here are made solely for identification or informational purposes, without implying any affiliation, endorsement, or partnership.
We make no representations or warranties, express or implied, regarding the accuracy, completeness, or suitability of any content or products presented. Nothing on this website should be construed as legal, tax, investment, financial, medical, or other professional advice. In addition, no part of this site - including articles or product references - constitutes a solicitation, recommendation, endorsement, advertisement, or offer to buy or sell any securities, franchises, or other financial instruments, particularly in jurisdictions where such activity would be unlawful.
All content is of a general nature and may not address the specific circumstances of any individual or entity. It is not a substitute for professional advice or services. Any actions you take based on the information provided here are strictly at your own risk. You accept full responsibility for any decisions or outcomes arising from your use of this website and agree to release us from any liability in connection with your use of, or reliance upon, the content or products found herein.